Tuesday, April 26, 2011

QRSS Archiver

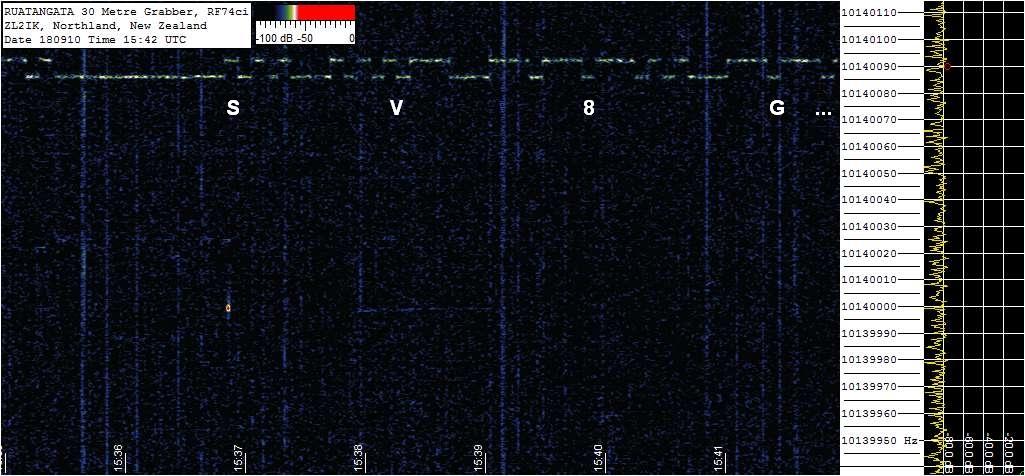
Everyone who is making experiments with slow code modes like QRSS, DFCW, FSKCW, HELL or any other fuzzy modes that require FFT spectogram images for decoding, soon or later realizes that the collection of reception reports is not an easy task. The main reason of this is the fact that these signals are fuzzy and even that they are produced automatically by keyers they require the human eye for decoding. This means that there is no way to develop a system for automatic collection of reception reports like WSPRnet, PSK Reporter, Reverse Beacon Network etc and all the decoding must be done manually from people who have free time for decoding and sending reports. If we take into account that the QRSS type modes are not so famous among radio amateurs then the QRSS experimenters must lean only on reports from mailing lists (e.g. QRSS Knights) and frequent checking of online grabbers that they have to do it by themselves. The problem of the online checking is that nobody has so much free time to do it for 24 hours and because of that we miss good reports during our work and sleep time.

The "QRSS Archiver" is a tiny command line application that I have developed in order to solve the problem of the manual online grabber check and covert it to an automatic archiving process. The "QRSS Archiver" accepts as command line parameters: a) the callsign of the online grabber, b) the URL of the FFT image and c) a checking interval in seconds.


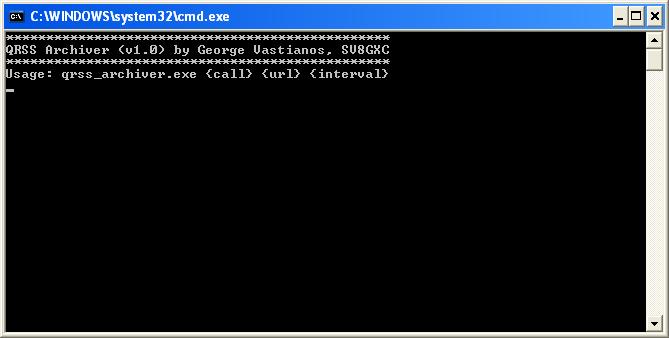
Execution of qrss_archiver.exe without parameters

When the application runs it creates a subfolder named with the callsign of the grabber and then it downloads the FFT image of the grabber into this subfolder and waits for the predefined time interval before the next download. Every time the application downloads a new FFT image it checks if it is the same with the previous one. If it is the same, the new image is discarded otherwise it is saved with a name that includes the callsign and the timestamp (e.g. ON5EX-110426-132306.jpg). The application can run in multiple instances and archiving the images of many grabbers at the same time. This can be done through a batch file that will load the qrss_archiver.exe multiple times and will pass the parameters for each instance.


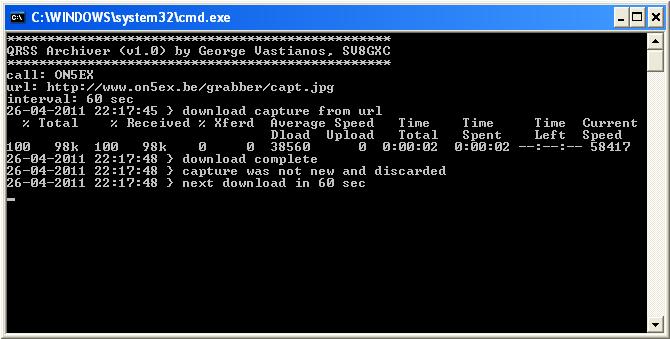
Execution of qrss_archiver.exe with parameters

The application does not need installation; only qrss_archiver.exe (12,5 kbytes) and curl.exe (265 kbytes) are required inside the same folder. If you want to download images from more than one grabber you need to include also a batch file. An example of a batch file is presented bellow:

file: testgrab.bat
qrss_archiver.exe PA0TAB http://pa0tab.nl/argo.jpg 60
qrss_archiver.exe W4HBK http://www.qsl.net/w4hbk/SL1.jpg 60
The above simple batch downloads images from the online grabbers of PA0TAB and W4HBK every 60 seconds. When the batch file is executed in Windows XP and above, all instances of qrss_archiver.exe are stacked as a group on the taskbar. In this case the user can right-click on the task group and select to tile the windows vertically or horizontally.


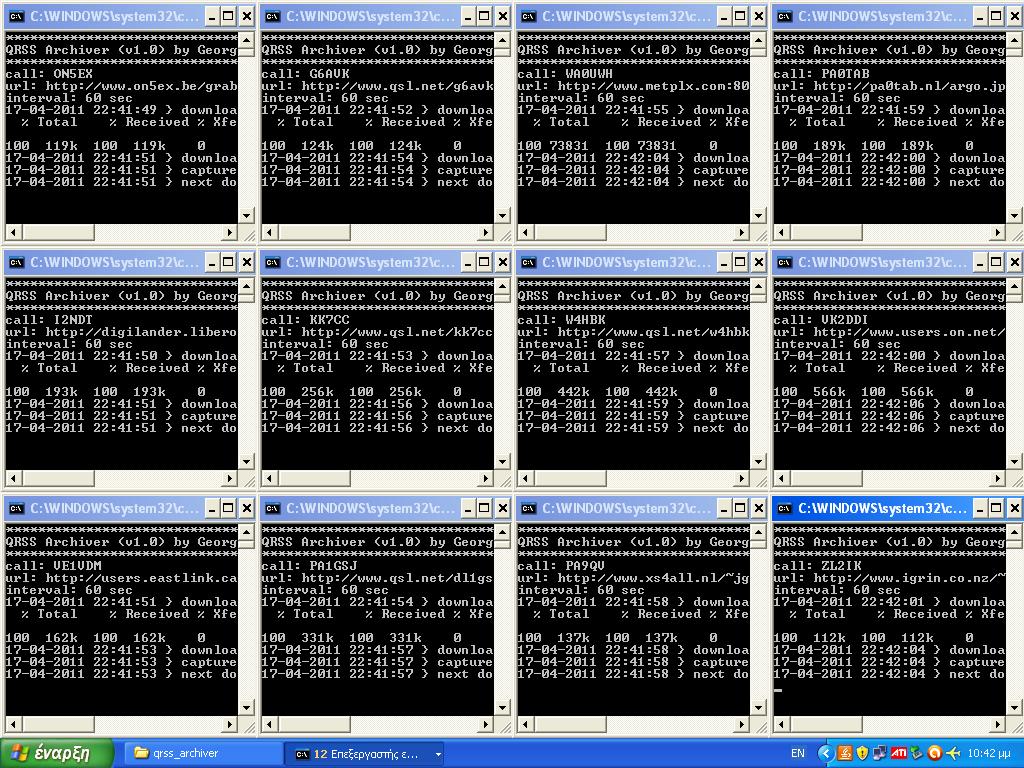
Multiple execution of qrss_archiver.exe through batch file

Are you QRSS experimenter in HF, MF, LF or VLF bands and you want to check if your signal reaches a distant grabber? Then try "QRSS Archiver" by yourself:

qrss_archiver.zip (171 kbytes)

References:
[1] QRSS Knights, Mailing List, http://cnts.be/mailman/listinfo/knightsqrss_cnts.be
[2] I2NDT, QRSS Knights Grabber Compendium, http://digilander.libero.it/i2ndt/grabber/grabber-compendium.htm
[3] Haxx, cURL command line tool, http://curl.haxx.se

Thursday, April 21, 2011

MEPT Log to KML Converter

Some months ago, during my MEPT experiments I started to collect reception reports of my signal through the QRSS Knights Mailing List and various QRSS online grabbers. Since the RST reports are meaningless for signals below noise levels, like QRSS, the best way to describe the quality of such signal is the FFT visual representation (spectogram) at the receiving end. The need of archiving visual and textual information into the same container format proved that the simple text based log format that is used for the 2-way QSOs was not suitable for this purpose. Aside from this I wanted to find a solution that will resolve the predescribed issue and also offer a better representation of the distance information between my MEPT and the receiving ends. Very soon I concluded that Keyhole Markup Language (KML) was the best option. KML is an XML notation for expressing geographic annotation and visualization within Internet based, 2-d maps and 3-d Earth browsers. KML was developed for use with Google Earth, which was originally named Keyhole Earth Viewer. It was created by Keyhole, Inc, which was acquired by Google in 2004.

The "MEPT Log to KML Converter" is a tiny application that I developed for converting and merging the data of a conventional log and the FFT images to an interactive KML file that can be viewed through Google Maps or Google Earth. The application has been developed in VBA (Visual Basic for Applications) and is embedded inside a Microsoft Excel file that works also as the log data container.


The MEPTLOG.xls template

The usage of the application is very simple and straightforward. The user needs only to make a copy of the MEPTLOG.xls template file, open it and activate macros. All the non-white cells are locked. The MEPT information (Call, Coordinates, Operation Dates, Grid Square, Op. Name, Location, Country, Frequency, Mode, Power etc) must be placed in line 8. The Receivers’ information (Call, Coordinates, Reception Date & Time, Grid Square, Op. Name, Location, Country, Distance, Km Per Watt, Comments and FFT Image URLs) must be placed in lines 11 and above and there is no limit for reception entries. The KML output filename must be placed inside the yellow cell in line 5. The KML creation process is executed by pressing the Ctrl+Shift+K keys.


The MEPTLOG.xls filled with sample data

The produced KML file can be viewed locally using Google Earth. Also there is possibility to embed the KML file inside a web page (e.g. Blog). In latter case, the KML file must be uploaded to an http server and then it can be viewed from embedded Google Earth or Google Maps objects inside the web page. The easiest way is through Google Maps where the user can place the KML url in the "search" textbox and get the HTML code from the "link" option.


How to get HTML code for embedding KML files

On the map, MEPT is displayed as a red placemark and the Receivers as green placemarks. When the user clicks on them, the clicked placemark log data is displayed.


Sample placemark log data

"MEPT Log to KML Converter" was used in my previous posts with the results of my first and second MEPT experiments. Do you want to display your MEPT logs through KML files? Then try "MEPT Log to KML Converter" by yourself! The following zip file includes the template and sample data files:

MEPTLOG.zip (61,8 kbytes)

References:
[1] QRSS Knights, Mailing List, http://cnts.be/mailman/listinfo/knightsqrss_cnts.be
[2] Wikipedia, Keyhole Markup Language, http://en.wikipedia.org/wiki/Keyhole_Markup_Language
[3] Google, Google Maps, http://maps.google.com
[4] Google, Google Earth, http://earth.google.com
[5] SV8GXC, Results of my first MEPT experiment, http://sv8gxc.blogspot.com/2010/09/results-of-my-first-mept-experiment.html
[6] SV8GXC, Results of my second MEPT experiment, http://sv8gxc.blogspot.com/2010/09/results-of-my-second-mept-experiment.html

Saturday, September 25, 2010

Results of my second MEPT experiment

From 16/9/2010 to 24/9/2010 my 30m MEPT was transmitting on 10140.080 KHz with FSKCW6 and only 160mW of power. This time the results were much better compared to the first experiment.

I received reports from 14 stations (DL4MGM, G4CDY, G6AVK, I2NDT, ON5EX, ON5SL, OZ9QV, PA0TAB, PA1GSJ, VE1VDM, VK2DDI, W1BW, W4HBK, ZL2IK) that are located on 10 DXCC countries (Germany, England, Italy, Belgium, Denmark, Netherlands, Canada, Australia, United States, New Zealand) and 3 continents (Europe, North America, Oceania). My longest DX was ZL2IK from New Zealand (again) but this time through long path! The long path distance between us (from KM17uw to RF74ci) is 22628 km and this rises my personal QRPp record to 141425 Km Per Watt!

The experiment results have been compiled as a KML file that is readable from Google Earth and Google Maps. In this way the reception reports log is more interactive. The color of each placemark defines the type of the station (MEPT or receiver). When the user clicks on a placemark the description of the reception report appears (date, time, location etc) including a small thumbnail of the received signal that is linked with the full size screenshot of the FFT software. The final result of the produced KML file is shown below:


View Larger Map

Many thanks to all stations that sent me their reports. More experiments will come with lower power levels and slower code speeds. Stay tuned!

References:
[1] QRSS Knights, Mailing List, http://cnts.be/mailman/listinfo/knightsqrss_cnts.be
[2] Google, Google Maps, http://maps.google.com
[3] Google, Google Earth, http://earth.google.com
[4] SV8GXC, Results of my first MEPT experiment, http://sv8gxc.blogspot.com/2010/09/results-of-my-first-mept-experiment.html

Sunday, September 19, 2010

My MEPT to ZL land through short and long path

Today was very special for my tests. This morning Peter ZL2IK from Northland, New Zealand, sent me a reception report through the QRSS Knights Mailing List and he was writing the following:

“Hi Knights and George

Within the last 24 hours I have received George SV8GXC on the Long Path, via the Atlantic and Pacific Oceans, and on the Short Path via the Middle East/Indian Ocean/and Australia. See attached grabs, taken overnight my time…”


Long path from SV to ZL


Short path from SV to ZL

With the help of DX Atlas software (by Alex VE3NEA), I was able to calculate the actual distance between my grid locator (KM17uw) and Peter’s ZL2IK grid locator (RF74ci). The distances for short and long paths are 17376km and 22628km. Based on the facts that my MEPT’s transmitting power is only 160mW and that ZL2IK is my longest DX, Peter’s new long path reception increased my personal KPW (Km Per Watt) score from 108600 KPW to 141425 KPW. Thanks Peter!


SP and LP distances on DX Atlas

References:
[1] SV8GXC, My 30m QRPp MEPT, http://sv8gxc.blogspot.com/2010/09/my-30m-qrpp-mept.html
[2] QRSS Knights, Mailing List, http://cnts.be/mailman/listinfo/knightsqrss_cnts.be
[3] VE3NEA, DX Atlas Software, http://www.dxatlas.com/DxAtlas

Saturday, September 18, 2010

Improvements on my 30m MEPT

On 14/9/2010 I changed the transmission mode from FSKCW3 to FSKCW6 (by reprogramming the keyer microcontroller) and went back on the air on same frequency. The 3 dB improvement on SNR (because of mode change) didn't seem to be enough to make my signal detectable on US grabbers (at least during daytime where I am not sleeping and I am able to check the websites). So next day (15/9/2010), after a lot of trials and errors, I succeed to remain within the 100Hz QRSS window and stay stable on 10140.075 after the MEPT's warm-up period. After my comment on QRSS Knights mailing list for the reason of my frequency change, I received the same day, an email from Bill W4HBK in Florida. Bill wrote me that he was receiving my signal "often" and it was "one of the strongest from Europe" BUT he forgot to send me the report through the mailing list. He commented that my signal was appearing every day around 3:30 UTC (during my sleep) when the local US signals fading out. He also sent some screenshots of my FSKCW6 signal and was asking more info about my antenna. Now, it was clear, that my FSKCW3 experiment was more successful than I thought. My signal was detected from USA grabbers but I was sleeping "too much"... to realize it!

The next days, I continued to transmit on a 24-hour basis because I wanted to check if I will receive better results with the FSKCW6 mode. From the first day, the MEPT was working without any special box for ground or thermal shielding. Even that this didn't seem to be a problem, after the frequency change (I did) to 10140.75, I realized (by checking the online grabbers) that every time I was sitting on my desk, my "body capacitance" was affecting the MEPT's unshielded crystal oscillator and the frequency was detuned several Hz according to the distance between my body and the oscillator. Also the last days' weather change had as result several degrees change in the room's temperature and of course changes on transmission frequency. These frequency changes made the situation worse than before my QSY from .030 to .075. Now my signal, most of the day, was somewhere around .060 and it was always mixed with European MEPTs!

The idea of continuing to operate without ground and thermal shielding was not good at all. I should do something as soon as possible otherwise it would be better to stop the experiments. Even that the usage of a crystal oven is the optimum solution in applications where thermal stability is very important, in my experiments this would require a lot of time for oven's design and construction and would give more complexity to the project (something I didn't want). So I decided to do something (on the "quick and dirty" basis) that will improve the frequency stability without being complex.


Above you see the improvements... is not something special but is effective and very far from "rocket science". I just installed the MEPT inside a metal box that is grounded and makes MEPT unaffected from "body capacitance" and nearby metal objects. The metal box is installed inside a Styrofoam box that isolates thermally the metal box from the room environment. When we say thermal "isolation", we mean thermal energy (heat) transfer through the Styrofoam material in a very slow rate. Do you wonder how this affects the thermal stability of the MEPT? Inside the MEPT's circuit there are 3 transistors & 2 voltage regulators that produce heat during transmission. Under normal conditions and when the circuit works in "open air", the produced heat is dissipated in room's environment very fast and the transistors' surface temperature is a little bit higher than room's temperature. When the MEPT works inside the Styrofoam box, the produced heat is trapped in the air (inside the metal box) and the Styrofoam material does not allow the heat to be dissipated fast in the room. The result is to have a temperature inside the metal box many degrees higher than the room and a very slow rate heat transfer from inside to outside (of the Styrofoam box). In practice the metal - Styrofoam box works like an oven and makes the internal temperature unaffected from the rapid and small range temperature changes inside the room.

The modifications took place on 16/9/2010. Since then the Styrofoam box is warm and the MEPT is almost "locked" on 10140.080. No more frequency drifts because of proximity or room temperature changes. Of course, if I turn on the air conditioner or move the MEPT outdoors, the Styrofoam box is not enough to keep stable the MEPT's temperature (because of the great external temperature changes). In this case, a real crystal oven is the only solution and it will be one of my future projects. BUT for indoor usage, Styrofoam can give good results without increase complexity!

Reference:
[1] SV8GXC, My 30m QRPp MEPT, http://sv8gxc.blogspot.com/2010/09/my-30m-qrpp-mept.html

Monday, September 13, 2010

Results of my first MEPT experiment

From 10/9/2010 to 12/9/2010 my 30m MEPT was transmitting on 10140.030 KHz with FSKCW3 and only 160mW of power. From the first day of operation, I started to receive repeated reports through the QRSS Knights mailing list with positive comments. Based on my QRPp power I can say that the final results exceeded my expectations.

I received reports from 12 stations (G3VYZ, G4CDY, G6AVK, I2NDT, IZ1KXQ, ON5EX, ON5SL, PA0TAB, PA1GSJ, VK2DDI, VK6JY, ZL2IK) that are located on 6 DXCC countries (England, Italy, Belgium, Netherlands, Australia, New Zealand) and 2 continents (Europe, Oceania). Until now my longest DX is ZL2IK from New Zealand. The distance between us (from KM17uw to RF74ci) is 17376 km and this rises my personal QRPp record to 108600 Km Per Watt!

In order to have a better visual representation of my experiment results, I created the log as a KML file that is readable from Google Earth and Google Maps. In this way the reception reports log is more interactive. The color of each placemark defines the type of the station (MEPT or receiver). When the user clicks on a placemark the description of the reception report appears (date, time, location etc) including a small thumbnail of the received signal that is linked with the full size screenshot of the FFT software. The final result of the produced KML file is shown below:


View Larger Map

What comes next? First of all I will reprogram tomorrow the microcontroller to increase the dot length from 3 to 6 seconds (FSKCW6) and see how this will affect the quality of my signal as according to theory this change must improve my SNR to about 3 dBs. Also I will try to change my transmit frequency to a more clear spot within the 100Hz window because I noticed that around 10140.030 KHz there was a lot of activity in US and this made my signal undetectable from the US online grabbers (because of local QRM). Stay tuned!

References:
[1] QRSS Knights, Mailing List, http://cnts.be/mailman/listinfo/knightsqrss_cnts.be
[2] Google, Google Maps, http://maps.google.com
[3] Google, Google Earth, http://earth.google.com

Wednesday, September 8, 2010

My 30m QRPp MEPT

After a long & detailed theoretical description of the subjects that rely on the QRSS – QRPp experimentation field of amateur radio, today I will present you my 30m QRPp MEPT. Although I have a long experience with QRP and QRPp experiments via 2-way QSOs, this is my first attempt to experiment with QRSS on QRPp levels via Manned Experimental Propagation Transmitters (MEPTs). My MEPT operates inside the QRSS window of the 30m HF band (10140.0 - 10140.1 KHz). The circuit consists of two units: the transmitter and the keyer. The transmitter is based on two bipolar NPN transistors that the first works as a Colpitts oscillator and the second as a buffer and one N-Channel FET that works as a low power amplifier. The transmitter circuit is 80% identical to the 30m QRSS Kit designed by G0XAR & G0UPL. The transmitter's amplified signal is filtered with a 7 element Chebyshev low pass filter based on the short guide to harmonic filters of G3RJV. The bias of the N-Channel FET has been calibrated to produce an output of 8Vp-p @ 50Ohms that is equal to 160mW.


The keyer unit is based on the AT90S2343 AVR RISC microcontroller produced by Atmel. The microcontroller is configured to run with the internal RC 1MHz oscillator and is programmed with the appropriate firmware (written in BASCOM-AVR from MCS Electronics) to produce a repeated slow morse cw message with my callsign "SV8GXC". The dot length was programmed to 3 seconds. The cw-key output of the microcontroller drives a reverse polarized red LED that works as varicap and shifts the oscillator frequency to about 8Hz. The final result is an FSKCW3 signal at 160mW.

The above MEPT was tested in lab and soon will be on the air for experiments in collaboration with the QRSS Knights group. It will be tested for some days on FSKCW3 and the results will be presented in the next post. Stay tuned!

References:
[1] G0UPL, 30m QRSS Kit, http://www.hanssummers.com/qrsskit.html
[2] G3RJV, A short guide to harmonic filters for
QRP transmitter output, http://www.gqrp.com/harmonic_filters.pdf
[3] Atmel, AT90S2343 Datasheet, http://www.atmel.com/dyn/resources/prod_documents/doc1004.pdf
[4] MCS Electronics, BASCOM-AVR, http://www.mcselec.com/index.php?option=com_content&task=view&id=14&Itemid=41