Tuesday, April 26, 2011

QRSS Archiver

Everyone who is making experiments with slow code modes like QRSS, DFCW, FSKCW, HELL or any other fuzzy modes that require FFT spectogram images for decoding, soon or later realizes that the collection of reception reports is not an easy task. The main reason of this is the fact that these signals are fuzzy and even that they are produced automatically by keyers they require the human eye for decoding. This means that there is no way to develop a system for automatic collection of reception reports like WSPRnet, PSK Reporter, Reverse Beacon Network etc and all the decoding must be done manually from people who have free time for decoding and sending reports. If we take into account that the QRSS type modes are not so famous among radio amateurs then the QRSS experimenters must lean only on reports from mailing lists (e.g. QRSS Knights) and frequent checking of online grabbers that they have to do it by themselves. The problem of the online checking is that nobody has so much free time to do it for 24 hours and because of that we miss good reports during our work and sleep time.

The "QRSS Archiver" is a tiny command line application that I have developed in order to solve the problem of the manual online grabber check and covert it to an automatic archiving process. The "QRSS Archiver" accepts as command line parameters: a) the callsign of the online grabber, b) the URL of the FFT image and c) a checking interval in seconds.
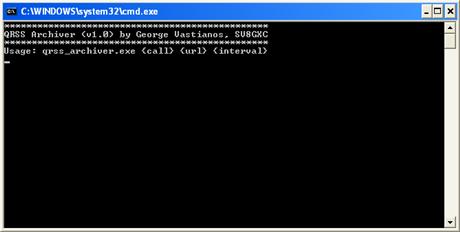

Execution of qrss_archiver.exe without parameters

When the application runs it creates a subfolder named with the callsign of the grabber and then it downloads the FFT image of the grabber into this subfolder and waits for the predefined time interval before the next download. Every time the application downloads a new FFT image it checks if it is the same with the previous one. If it is the same, the new image is discarded otherwise it is saved with a name that includes the callsign and the timestamp (e.g. ON5EX-110426-132306.jpg). The application can run in multiple instances and archiving the images of many grabbers at the same time. This can be done through a batch file that will load the qrss_archiver.exe multiple times and will pass the parameters for each instance.
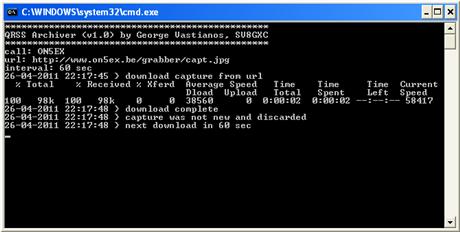

Execution of qrss_archiver.exe with parameters

The application does not need installation; only qrss_archiver.exe (12,5 kbytes) and curl.exe (265 kbytes) are required inside the same folder. If you want to download images from more than one grabber you need to include also a batch file. An example of a batch file is presented bellow:

file: testgrab.bat
qrss_archiver.exe PA0TAB http://pa0tab.nl/argo.jpg 60
qrss_archiver.exe W4HBK http://www.qsl.net/w4hbk/SL1.jpg 60
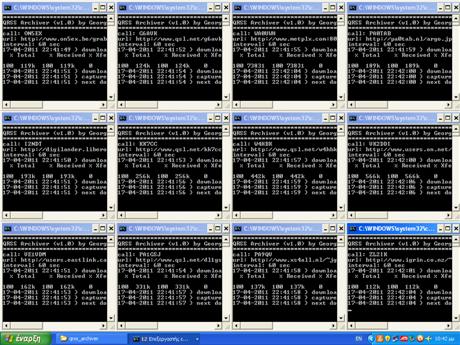
The above simple batch downloads images from the online grabbers of PA0TAB and W4HBK every 60 seconds. When the batch file is executed in Windows XP and above, all instances of qrss_archiver.exe are stacked as a group on the taskbar. In this case the user can right-click on the task group and select to tile the windows vertically or horizontally.


Multiple execution of qrss_archiver.exe through batch file

Are you QRSS experimenter in HF, MF, LF or VLF bands and you want to check if your signal reaches a distant grabber? Then try "QRSS Archiver" by yourself:

qrss_archiver.zip (171 kbytes)

References:
[1] QRSS Knights, Mailing List, http://cnts.be/mailman/listinfo/knightsqrss_cnts.be
[2] I2NDT, QRSS Knights Grabber Compendium, http://digilander.libero.it/i2ndt/grabber/grabber-compendium.htm
[3] Haxx, cURL command line tool, http://curl.haxx.se
Thursday, April 21, 2011

MEPT Log to KML Converter

Some months ago, during my MEPT experiments I started to collect reception reports of my signal through the QRSS Knights Mailing List and various QRSS online grabbers. Since the RST reports are meaningless for signals below noise levels, like QRSS, the best way to describe the quality of such signal is the FFT visual representation (spectogram) at the receiving end. The need of archiving visual and textual information into the same container format proved that the simple text based log format that is used for the 2-way QSOs was not suitable for this purpose. Aside from this I wanted to find a solution that will resolve the predescribed issue and also offer a better representation of the distance information between my MEPT and the receiving ends. Very soon I concluded that Keyhole Markup Language (KML) was the best option. KML is an XML notation for expressing geographic annotation and visualization within Internet based, 2-d maps and 3-d Earth browsers. KML was developed for use with Google Earth, which was originally named Keyhole Earth Viewer. It was created by Keyhole, Inc, which was acquired by Google in 2004.

The "MEPT Log to KML Converter" is a tiny application that I developed for converting and merging the data of a conventional log and the FFT images to an interactive KML file that can be viewed through Google Maps or Google Earth. The application has been developed in VBA (Visual Basic for Applications) and is embedded inside a Microsoft Excel file that works also as the log data container.


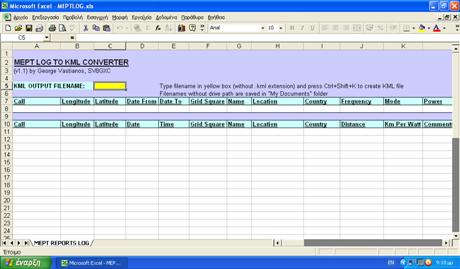
The MEPTLOG.xls template

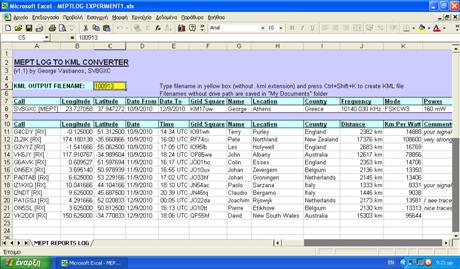
The usage of the application is very simple and straightforward. The user needs only to make a copy of the MEPTLOG.xls template file, open it and activate macros. All the non-white cells are locked. The MEPT information (Call, Coordinates, Operation Dates, Grid Square, Op. Name, Location, Country, Frequency, Mode, Power etc) must be placed in line 8. The Receivers’ information (Call, Coordinates, Reception Date & Time, Grid Square, Op. Name, Location, Country, Distance, Km Per Watt, Comments and FFT Image URLs) must be placed in lines 11 and above and there is no limit for reception entries. The KML output filename must be placed inside the yellow cell in line 5. The KML creation process is executed by pressing the Ctrl+Shift+K keys.


The MEPTLOG.xls filled with sample data

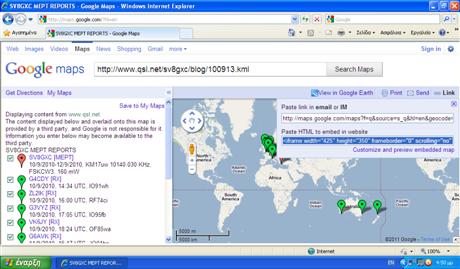
The produced KML file can be viewed locally using Google Earth. Also there is possibility to embed the KML file inside a web page (e.g. Blog). In latter case, the KML file must be uploaded to an http server and then it can be viewed from embedded Google Earth or Google Maps objects inside the web page. The easiest way is through Google Maps where the user can place the KML url in the "search" textbox and get the HTML code from the "link" option.


How to get HTML code for embedding KML files

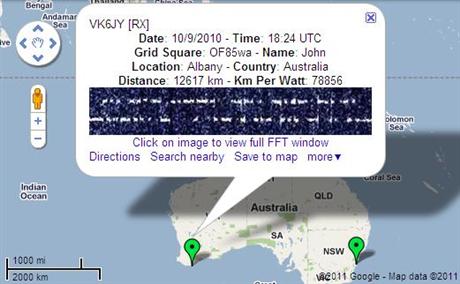
On the map, MEPT is displayed as a red placemark and the Receivers as green placemarks. When the user clicks on them, the clicked placemark log data is displayed.


Sample placemark log data

"MEPT Log to KML Converter" was used in my previous posts with the results of my first and second MEPT experiments. Do you want to display your MEPT logs through KML files? Then try "MEPT Log to KML Converter" by yourself! The following zip file includes the template and sample data files:

MEPTLOG.zip (61,8 kbytes)

References:
[1] QRSS Knights, Mailing List, http://cnts.be/mailman/listinfo/knightsqrss_cnts.be
[2] Wikipedia, Keyhole Markup Language, http://en.wikipedia.org/wiki/Keyhole_Markup_Language
[3] Google, Google Maps, http://maps.google.com
[4] Google, Google Earth, http://earth.google.com
[5] SV8GXC, Results of my first MEPT experiment, http://sv8gxc.blogspot.com/2010/09/results-of-my-first-mept-experiment.html
[6] SV8GXC, Results of my second MEPT experiment, http://sv8gxc.blogspot.com/2010/09/results-of-my-second-mept-experiment.html