Showing posts with label KML. Show all posts

Thursday, April 21, 2011

MEPT Log to KML Converter

Some months ago, during my MEPT experiments I started to collect reception reports of my signal through the QRSS Knights Mailing List and various QRSS online grabbers. Since the RST reports are meaningless for signals below noise levels, like QRSS, the best way to describe the quality of such signal is the FFT visual representation (spectogram) at the receiving end. The need of archiving visual and textual information into the same container format proved that the simple text based log format that is used for the 2-way QSOs was not suitable for this purpose. Aside from this I wanted to find a solution that will resolve the predescribed issue and also offer a better representation of the distance information between my MEPT and the receiving ends. Very soon I concluded that Keyhole Markup Language (KML) was the best option. KML is an XML notation for expressing geographic annotation and visualization within Internet based, 2-d maps and 3-d Earth browsers. KML was developed for use with Google Earth, which was originally named Keyhole Earth Viewer. It was created by Keyhole, Inc, which was acquired by Google in 2004.

The "MEPT Log to KML Converter" is a tiny application that I developed for converting and merging the data of a conventional log and the FFT images to an interactive KML file that can be viewed through Google Maps or Google Earth. The application has been developed in VBA (Visual Basic for Applications) and is embedded inside a Microsoft Excel file that works also as the log data container.
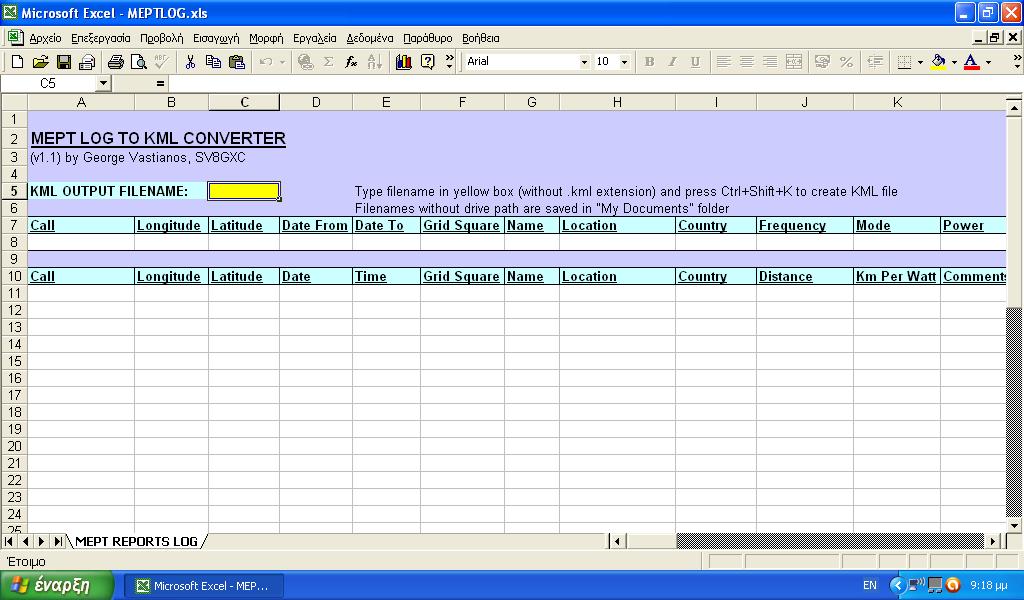

The MEPTLOG.xls template

The usage of the application is very simple and straightforward. The user needs only to make a copy of the MEPTLOG.xls template file, open it and activate macros. All the non-white cells are locked. The MEPT information (Call, Coordinates, Operation Dates, Grid Square, Op. Name, Location, Country, Frequency, Mode, Power etc) must be placed in line 8. The Receivers’ information (Call, Coordinates, Reception Date & Time, Grid Square, Op. Name, Location, Country, Distance, Km Per Watt, Comments and FFT Image URLs) must be placed in lines 11 and above and there is no limit for reception entries. The KML output filename must be placed inside the yellow cell in line 5. The KML creation process is executed by pressing the Ctrl+Shift+K keys.


The MEPTLOG.xls filled with sample data

The produced KML file can be viewed locally using Google Earth. Also there is possibility to embed the KML file inside a web page (e.g. Blog). In latter case, the KML file must be uploaded to an http server and then it can be viewed from embedded Google Earth or Google Maps objects inside the web page. The easiest way is through Google Maps where the user can place the KML url in the "search" textbox and get the HTML code from the "link" option.
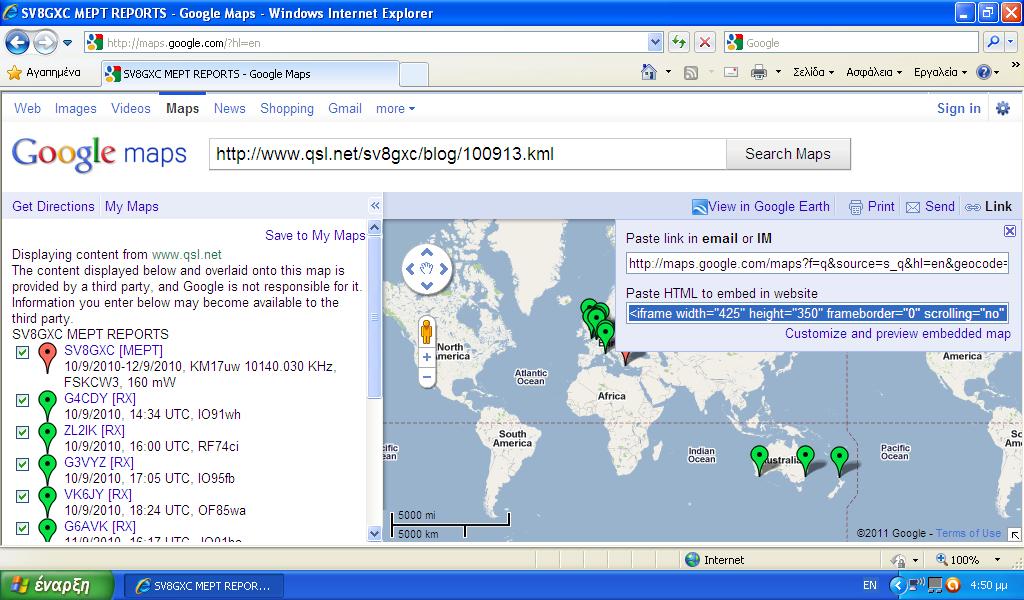

How to get HTML code for embedding KML files

On the map, MEPT is displayed as a red placemark and the Receivers as green placemarks. When the user clicks on them, the clicked placemark log data is displayed.
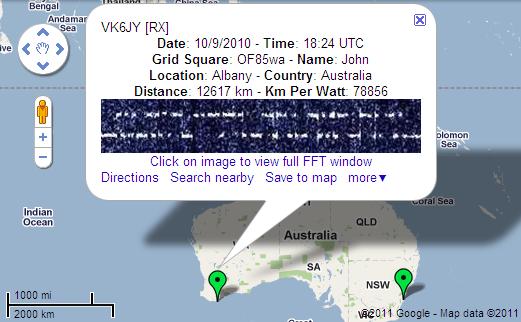

Sample placemark log data

"MEPT Log to KML Converter" was used in my previous posts with the results of my first and second MEPT experiments. Do you want to display your MEPT logs through KML files? Then try "MEPT Log to KML Converter" by yourself! The following zip file includes the template and sample data files:

MEPTLOG.zip (61,8 kbytes)

References:
[1] QRSS Knights, Mailing List, http://cnts.be/mailman/listinfo/knightsqrss_cnts.be
[2] Wikipedia, Keyhole Markup Language, http://en.wikipedia.org/wiki/Keyhole_Markup_Language
[3] Google, Google Maps, http://maps.google.com
[4] Google, Google Earth, http://earth.google.com
[5] SV8GXC, Results of my first MEPT experiment, http://sv8gxc.blogspot.com/2010/09/results-of-my-first-mept-experiment.html
[6] SV8GXC, Results of my second MEPT experiment, http://sv8gxc.blogspot.com/2010/09/results-of-my-second-mept-experiment.html

Saturday, September 25, 2010

Results of my second MEPT experiment

From 16/9/2010 to 24/9/2010 my 30m MEPT was transmitting on 10140.080 KHz with FSKCW6 and only 160mW of power. This time the results were much better compared to the first experiment.

I received reports from 14 stations (DL4MGM, G4CDY, G6AVK, I2NDT, ON5EX, ON5SL, OZ9QV, PA0TAB, PA1GSJ, VE1VDM, VK2DDI, W1BW, W4HBK, ZL2IK) that are located on 10 DXCC countries (Germany, England, Italy, Belgium, Denmark, Netherlands, Canada, Australia, United States, New Zealand) and 3 continents (Europe, North America, Oceania). My longest DX was ZL2IK from New Zealand (again) but this time through long path! The long path distance between us (from KM17uw to RF74ci) is 22628 km and this rises my personal QRPp record to 141425 Km Per Watt!

The experiment results have been compiled as a KML file that is readable from Google Earth and Google Maps. In this way the reception reports log is more interactive. The color of each placemark defines the type of the station (MEPT or receiver). When the user clicks on a placemark the description of the reception report appears (date, time, location etc) including a small thumbnail of the received signal that is linked with the full size screenshot of the FFT software. The final result of the produced KML file is shown below:


View Larger Map

Many thanks to all stations that sent me their reports. More experiments will come with lower power levels and slower code speeds. Stay tuned!

References:
[1] QRSS Knights, Mailing List, http://cnts.be/mailman/listinfo/knightsqrss_cnts.be
[2] Google, Google Maps, http://maps.google.com
[3] Google, Google Earth, http://earth.google.com
[4] SV8GXC, Results of my first MEPT experiment, http://sv8gxc.blogspot.com/2010/09/results-of-my-first-mept-experiment.html

Monday, September 13, 2010

Results of my first MEPT experiment

From 10/9/2010 to 12/9/2010 my 30m MEPT was transmitting on 10140.030 KHz with FSKCW3 and only 160mW of power. From the first day of operation, I started to receive repeated reports through the QRSS Knights mailing list with positive comments. Based on my QRPp power I can say that the final results exceeded my expectations.

I received reports from 12 stations (G3VYZ, G4CDY, G6AVK, I2NDT, IZ1KXQ, ON5EX, ON5SL, PA0TAB, PA1GSJ, VK2DDI, VK6JY, ZL2IK) that are located on 6 DXCC countries (England, Italy, Belgium, Netherlands, Australia, New Zealand) and 2 continents (Europe, Oceania). Until now my longest DX is ZL2IK from New Zealand. The distance between us (from KM17uw to RF74ci) is 17376 km and this rises my personal QRPp record to 108600 Km Per Watt!

In order to have a better visual representation of my experiment results, I created the log as a KML file that is readable from Google Earth and Google Maps. In this way the reception reports log is more interactive. The color of each placemark defines the type of the station (MEPT or receiver). When the user clicks on a placemark the description of the reception report appears (date, time, location etc) including a small thumbnail of the received signal that is linked with the full size screenshot of the FFT software. The final result of the produced KML file is shown below:


View Larger Map

What comes next? First of all I will reprogram tomorrow the microcontroller to increase the dot length from 3 to 6 seconds (FSKCW6) and see how this will affect the quality of my signal as according to theory this change must improve my SNR to about 3 dBs. Also I will try to change my transmit frequency to a more clear spot within the 100Hz window because I noticed that around 10140.030 KHz there was a lot of activity in US and this made my signal undetectable from the US online grabbers (because of local QRM). Stay tuned!

References:
[1] QRSS Knights, Mailing List, http://cnts.be/mailman/listinfo/knightsqrss_cnts.be
[2] Google, Google Maps, http://maps.google.com
[3] Google, Google Earth, http://earth.google.com